Statistical Analysis
The initial data we had of the flight prices after cleaning had the following distribution -
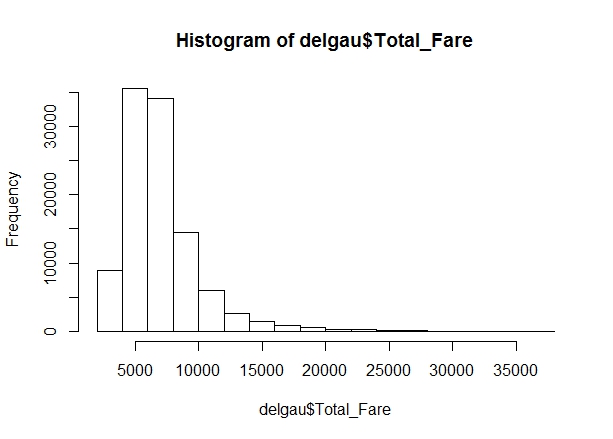
With the moments of Kurtosis was 10.5 and skewness was 3.4 when the entire data was considered. For each interval, all the moments are shown.
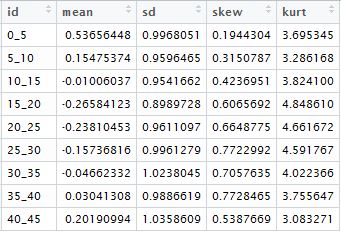
On observation, it was observed that the data of flight prices followed a lognormal distribution, and upon transformation the distribution came out as follows.
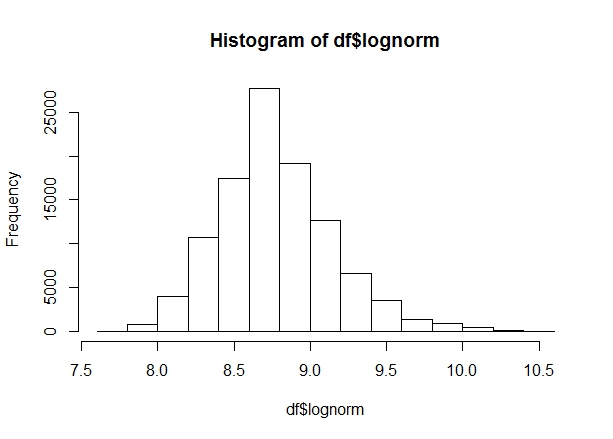
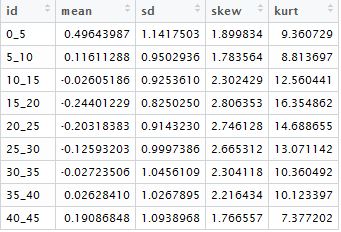
This distribution now appeared to be very much like the normal distribution, so we decided to further examine the data. We calculated the moments as done above to find out that after transformation. The skewness was 0.4 and the kurtosis was 3.8 for the entire data with the moments for each interval as follows -
Further examining the data, we found the QQ plots and the PP plots for the same considering the transformed distribution to follow normal distribution -
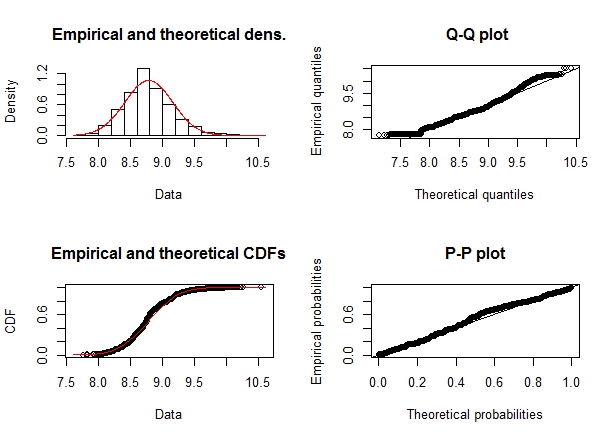
From the analysis we can see that the data almost closely resembles the normal distribution.
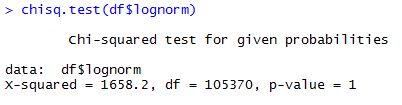
Further we decided to use the hypothesis testing and find out the chi-square and p-value. We used the Pearson normality test for the same and the results are as below -
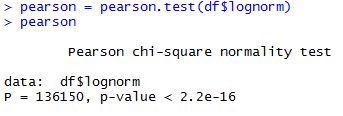
The p-value signifies that our transformed data closely follows normal distribution.